Unique Values Between Columns
A common thing to check in data is whether the values in one column uniquely match to the values of another column. This post is a quick bit of Python code to try to visualize that situation.
Plan
The overall goal is to get code to do as follows:
- Take a dataframe and a set of columns (or the entire dataframe if no columns are selected).
- For each pair of variables (the uniqueness being checked isn’t commutative, so we need all \(n*(n-1)\) possibilities examined:
- Group the data the first variable
- Calculate the number of unique values for the second variable in each group.
- Store the result in the appropriate cell of an \(n\times n\) matrix or dataframe.
- Plot the result as a heatmap or color mesh, with two colors – one for when each group only has one unique value and one when there’s more than one unique value.
The data being used is a 2020 measurement of U.S. air quality, broken down by monitoring station – the link and descriptions of the data can be found here.
First, loading the data and the necessary libraries:
import matplotlib.colors as colors
import pandas as pd
import seaborn

concentration_data = pd.read_csv("annual_conc_by_monitor_2020.csv")
There are 55 variables with about 62,000 rows, though only seven columns will be used here to keep things simple. There is some missing data in some of the columns that we aren’t using.
Code
Ultimately, I’m trying to come up with a square matrix or dataframe to hold all of these records. The initial plan was to do something like initializing a numpy array and then computing each cell of the array individually, but it turns out that the indexing in pandas actually works perfectly for this situation.
To start with, initialize an empty dataframe with index and column names being the variable names of the data of interest:
columns = ["State Code", "County Code", "Site Num", "POC", "Latitude", "Longitude", "Datum"]
data_subset = concentration_data[columns]
check_frame = pd.DataFrame(index=data_subset.columns, columns=data_subset.columns)
check_frame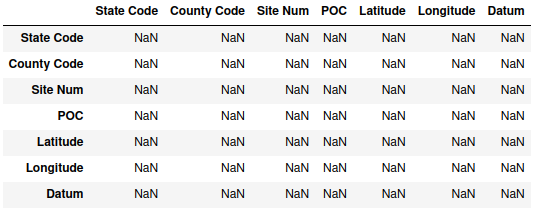
From there, all that needs to be done is to iterate over the columns, check whether all groups have only one unique value, and then rely on pandas' indexing ability to put all the values in the correct cells:
for c in data_subset.columns:
    unique_count = data_subset.groupby(c).nunique(dropna=True)
    output = unique_count.apply(lambda x: (x==1).all()*1, axis=0)
    check_frame[c] = output
check_frame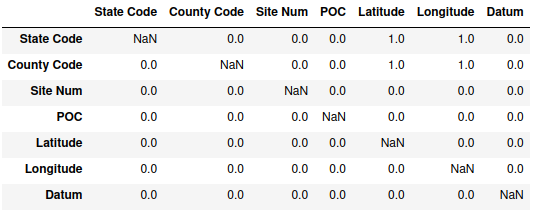
Values of 1 correspond to when the variable in the column has only one unique value per value of the variable in the row – for instance, State Code is unique for each value of Latitude and Longitude. A zero indicates that there is at least one value in the column variable which has more than one unique value in the grouping variable in the row. Since the default values for the empty dataframe are all NaN, and the code never has the same column for both grouping and checking unique values, those values all remain missing.
There are better ways to visualize it, though. The simplest would be calling upon pandas.DataFrame.style.background_gradient() to color the cells, as it doesn’t call any additional libraries. It’s not bad, though the behavior with the missing values is a little odd:
check_frame.style.background_gradient(cmap='Blues')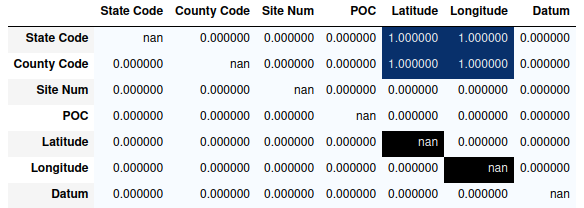
Something a bit neater would be to plot it as a sort of heatmap, since it can be a bit simpler to look only at color.
unique_colors = colors.ListedColormap(["#990000", "#33EE33"])
seaborn.heatmap(check_frame, square=True, cmap=unique_colors, cbar=False)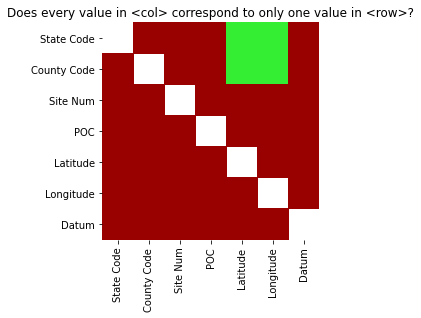
seaborn.heatmap() renders missing values as white, with the 0 and 1 values in this case set to be red and green respectively.
Full Function
The final function is:
def uniqueness_check_plot(df, columns=None, dropna=True):
    if columns is not None:
        df = df[columns]
    check_frame = pd.DataFrame(index=df.columns, columns=df.columns)
    for c in df.columns:
        unique_count = df.groupby(c).nunique(dropna=dropna)
        output = unique_count.apply(lambda x: (x==1).all()*1, axis=0)
        check_frame[c] = output
    unique_colors = colors.ListedColormap(["#990000", "#33EE33"])
    ax = seaborn.heatmap(check_frame, square=True, cmap=unique_colors, cbar=False)
    ax.set_title("Does every value in <col> correspond to only one value in <row>?")
    return ax