Formatting With ggtext Example
This is a quick example regarding the ggtext package. It’s one of the many packages that extends ggplot2, with this one having a focus on adding and formatting text in graphs. The particularly interesting thing for me is that it allows Markdown and other formatting of the labels in a graph.
Let’s throw together a facet plot for the principal components of the iris dataset:
> library(glue)
> library(tidyverse)
> library(ggtext)

> data(iris)
> pca <- prcomp(iris %>% select(matches("Sepal|Petal")))
> transformation <- as.data.frame(pca$rotation)  # prcomp returns matrix, ggplot needs df
> transformation

                     PC1         PC2         PC3        PC4
Sepal.Length  0.36138659 -0.65658877  0.58202985  0.3154872
Sepal.Width  -0.08452251 -0.73016143 -0.59791083 -0.3197231
Petal.Length  0.85667061  0.17337266 -0.07623608 -0.4798390
Petal.Width   0.35828920  0.07548102 -0.54583143  0.7536574
Since we need to get this to a facet plot, we need to pivot this data into a long format. We need to also preserve the row names, since pivot_longer() will just erase them otherwise. This is also when we can add in our Markdown formatting, which will just be italicizing the negative-valued elements of the rotations and bolding the positive parts:
> transformation <- transformation %>% mutate(Var=row.names(.)) %>%
>     pivot_longer(cols=c(PC1, PC2, PC3, PC4)) %>%
>     mutate(VarStyle=ifelse(value>0, "**", "*"),
>            MarkdownVar=glue("{VarStyle}{Var}{VarStyle}"))
After that, it’s a simple case of using ggplot(). ggtext is invoked for the element_markdown() function, which is what does the rendering:
ggplot(transformation, aes(x=MarkdownVar, y=value, fill=value>0)) +
    geom_col() + coord_flip() + facet_wrap(~name, scales="free_y") +
    theme(axis.text.y=element_markdown())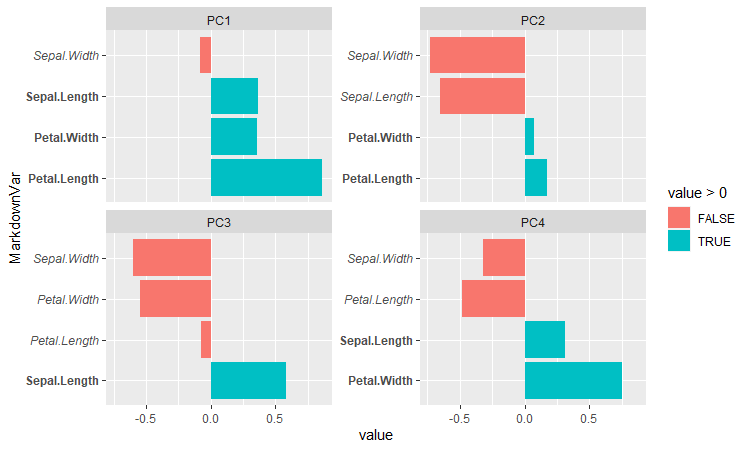
Or, suppose you wanted to do it in color instead. Markdown itself doesn’t handle this, but ggtext does allow for some basic HTML/CSS formatting:
> transformation <- transformation %>%
>     mutate(VarColor=ifelse(value>0, "#00A000", "#A00000"),   # hex codes for medium green and red
>            ColoredVar=glue("<span style='color:{VarColor}'>{Var}</span>"))
> ggplot(transformation, aes(x=ColoredVar, y=value, fill=value>0)) +
>     geom_col() + coord_flip() + facet_wrap(~name, scales="free_y") +
>     theme(axis.text.y=element_markdown())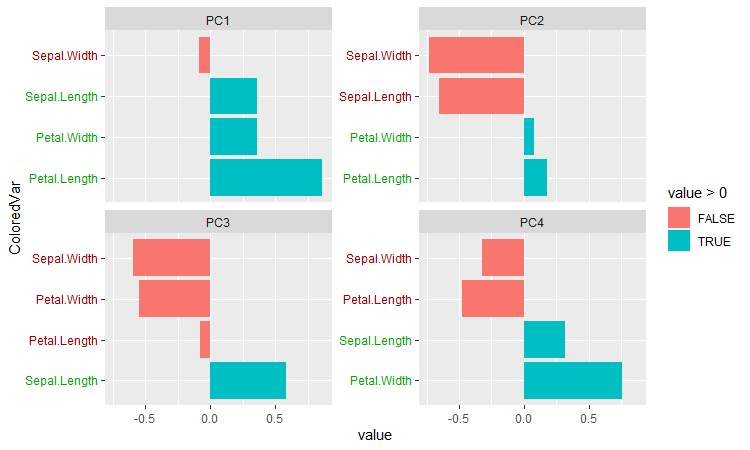
The documentation indicates that the package currently only supports a fairly limited subset of Markdown, HTML, and CSS, but it already looks pretty formidable – the examples include being able to use images as labels for a discrete axis, which is pretty interesting. It feels like it’ll need a lot of mutate() and glue() calls in the workflow, like I used above, but that’s not much of an issue.